Module 2 Assignment
Question 1 – Determining Missing Information Using the Accounting Equation
Use your knowledge of accounting relations to complete the following table for Boatsman Company.
Note: Use a negative sign to indicate a net loss.
| 2020 | 2019 | |
|---|---|---|
| Beginning retained earnings | $189,089 | ?? |
| Net income (loss) | ?? | 48,192 |
| Dividends | 0 | 15,060 |
| Ending retained earnings | $169,634 | ?? |
Solution

Correct
Marks for this submission: 3.00/3.00.
…Please click on the Icon below to purchase the FULL SOLUTION PACKAGE at only $10
Related: (Solution) Module 3 Assignment – Compute NOPAT
Question 2 – Identifying and Classifying Balance Sheet and Income Statement Accounts
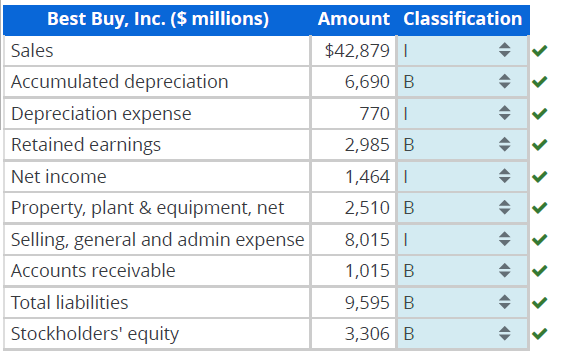
Following are selected accounts for Best Buy, Inc., for the fiscal year ended February 2, 2019.
(a) Indicate whether each account appears on the balance sheet (B) or income statement (I).
| Best Buy, Inc. ($ millions) | Amount | Classification |
|---|---|---|
| Sales | $42,879 | |
| Accumulated depreciation | 6,690 | |
| Depreciation expense | 770 | |
| Retained earnings | 2,985 | |
| Net income | 1,464 | |
| Property, plant & equipment, net | 2,510 | |
| Selling, general and admin expense | 8,015 | |
| Accounts receivable | 1,015 | |
| Total liabilities | 9,595 | |
| Stockholders’ equity | 3,306 |
(b) Using the data, compute total assets and total expenses.
Solution
(a) Indicate whether each account appears on the balance sheet (B) or income statement (I).

…Please click on the Icon below to purchase the FULL SOLUTION PACKAGE at only $10
Related: (Solved) Module 4 Assignment Compute profitability measures RNOA
Question 3– Comparing Income Statements and Balance Sheets of Competitors
Following are selected income statement and balance sheet data from two retailers: Abercrombie & Fitch (clothing in the high-end market) and TJX Companies (clothing retailer in the value priced market), for the fiscal year ended February 2, 2019.
(a) Express each income statement amount as a percentage of sales.
Round your answers to one decimal place (ex: 0.2345 = 23.5%)
| Income Statement | ||
| ($ thousands) | ANF | TJX |
| Sales | $3,590,109 | $38,972,934 |
| Cost of goods sold | 1,430,193 | 27,831,177 |
| Gross profit | 2,159,916 | 11,141,757 |
| Total expenses | 2,081,108 | 8,081,959 |
| Net income | $78,808 | $3,059,798 |
(b) Express each balance sheet amount as a percentage of total assets.
Round your answers to one decimal place (ex: 0.2345 = 23.5%).
| Balance Sheet | ||
| ($ thousands) | ANF | TJX |
| Current assets | $1,335,950 | $8,469,222 |
| Long-term assets | 1,049,643 | 5,856,807 |
| Total assets | $2,385,593 | $14,326,029 |
| Current liabilities | $558,917 | $5,531,374 |
| Long-term liabilities | 608,055 | 3,746,049 |
| Total liabilities | 1,166,972 | 9,277,423 |
| Stockholders’ equity | 1,218,621 | 5,048,606 |
| Total liabilities and equity | $2,385,593 | $14,326,029 |
Which of the following statements about business models is most consistent with the computations for part (a)?
- ANF’s expenses as a percentage of sales are higher because it spends more on advertising than does TJX.
- ANF is a high-end retailer that is able to charge high prices for its products, but bears substantial operating costs to support its “shopping experience.
- “ANF’s profit is higher than TJX’s as a percentage of sales because its sales are higher than TJX’s.
- ANF’s gross profit is higher than TJX’s because its sales volume allows it to manufacture clothes at a lower per unit cost than can TJX.
Which of the following statements about business models is most consistent with the computations for part (b)?
- ANF reports lower current assets as a percentage of total assets because it pays its vendors on a more timely basis than does TJX.
- ANF reports higher long-term assets as a percentage of total assets because it depreciates its long-term assets more slowly than does TJX.
- ANF reports lower current assets and higher long-term assets as a percentage of total assets because it carries less inventory and has a greater capital investment in its stores than does TJX.
- ANF reports lower current assets as a percentage of total assets because it is a smaller company and cannot afford the investment in inventory.
(c) Which company has a lower proportion of debt? What do the ratios tell us about relative riskiness of the two companies?
- ANF has a lower proportion of debt than does TJX, which implies that ANF is less risky than TJX.
- TJX has a lower proportion of debt than does ANF, which implies that TJX is less risky than ANF.
- ANF has a higher proportion of debt than does TJX, which implies that ANF is less risky than TJX.
- TJX has a higher proportion of debt than does ANF, which implies that TJX is less risky than ANF.
Feedback
Correct
Marks for this submission: 29.00/29.00
…Please click on the Icon below to purchase the FULL SOLUTION PACKAGE at only $10
Related: (Solved) Module 5 Assignment – Analyzing and Interpreting Income Disclosures
Question 4 – Comparing Operating Characteristics Across Industries
Following are selected income statement and balance sheet data for companies in different industries.
| $ millions | Sales | Cost of Goods Sold | Net Income | Assets | Liabilities | Stockholders’ Equity |
|---|---|---|---|---|---|---|
| Target Corp. | $75,356 | $53,299 | $2,937 | $41,290 | $29,993 | $11,297 |
| Nike, Inc. | 36,397 | 20,441 | 1,933 | 22,536 | 12,724 | 9,812 |
| Harley-Davidson | 5,717 | 3,352 | 531 | 10,666 | 8,892 | 1,774 |
| Pfizer | 53,647 | 11,248 | 11,188 | 159,422 | 95,664 | 63,758 |
(a) Compute the following ratios for each company.
- Round all answers to one decimal place (percentage answer example: 0.2345 = 23.5%).
- Note: The liabilities to stockholders’ equity ratio should not be converted into a percentage answer (round answers to one decimal place, for example: 0.452 = 0.5).
(b) Which of the following statements about business models best describes the differences in gross (and net) profit margin that we observe?
The higher gross profit companies are typically those that have some competitive advantage that allows them to charge a market price for their products that cannot be easily competed away.
The lower gross profit companies are those that can manufacture their products at the lowest cost.
The higher gross profit companies are those that sell the highest unit volumes.
The lower gross profit companies are those that charge a higher price for their products.
(c) Which company reports the highest ratio of net income to equity?
Which of the following statements best describes the differences in the ratio of net income to equity that we observe?
- The highest return to equity companies are those that are able to keep their operating costs the lowest.
- The highest return on equity companies are those that maintain high levels of debt and, as a result, reduce their utilization of equity.
- The highest return on equity companies are those that are able to sustain some competitive advantage that leads to higher profitability and are also able to minimize their use of equity.
- The lowest return on equity companies are those that are able to charge high prices for their products and, thus, report the highest gross profit-to-sales ratio.
(d) Which company has financed itself with the highest percentage of liabilities to equity?
Which of the following statements best describes the reason why some companies are able to take on higher levels of debt than are others?
- Companies that can sustain higher levels of debt generally operate in consumer products industries.
- Companies that can sustain higher levels of debt are typically larger companies.
- Companies that can sustain higher levels of debt are typically those with the most stable and positive cash flows.
- Companies that can sustain higher levels of debt are generally younger companies whose market values are relatively low and, as a result, cannot raise equity capital.
…Please click on the Icon below to purchase the FULL SOLUTION PACKAGE at only $10
Question 5
Partially correct
Mark 81.00 out of 95.00
Question text
Analyzing Transactions Using the Financial Statement Effects Template
Hanlon Advertising Company began the current month with the following balance sheet.
| Cash | $ 80,000 | Liabilities | $ 70,000 |
| Noncash assets | 135,000 | Contributed capital | 110,000 |
| Earned capital | 35,000 | ||
| Total assets | $215,000 | Total liabilities and equity | $215,000 |
Following are summary transactions that occurred during the current month.
- The company purchased supplies for $5,000 cash; none were used this month.
- Services of $2,500 were performed this month on credit.
- Services were performed for $10,000 cash this month.
- The company purchased advertising for $8,000 cash; the ads will run next month.
- The company received $1,200 cash as partial payment on accounts receivable from transaction 2.
- The company paid $3,400 cash toward the accounts payable balance reported at the beginning of the month.
- Paid $3,500 cash toward this month’s wages expenses.
- The company declared and paid dividends of $500 cash.
(a) Record the effects of each transaction using the financial statement effects template.
Use negative signs with your answers, when appropriate.
(b) Prepare the income statement for this month and the balance sheet as of month-end.
Do not use negative signs with any of your answers below.
Do not use negative signs with any of your answers below.


