Module 1 Assignment – Financial Reporting and Control
Questions
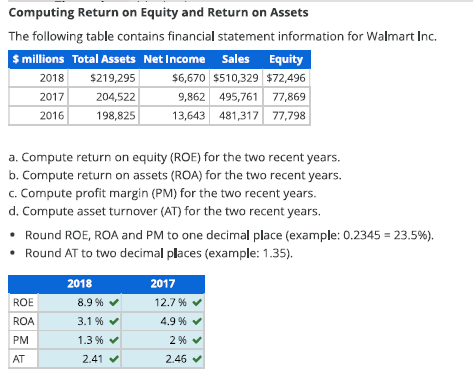
Question 1 – Computing Return on Equity and Return on Assets
The following table contains financial statement information for Walmart Inc.
| $ millions | Total Assets | Net Income | Sales | Equity |
|---|---|---|---|---|
| 2018 | $219,295 | $6,670 | $510,329 | $72,496 |
| 2017 | 204,522 | 9,862 | 495,761 | 77,869 |
| 2016 | 198,825 | 13,643 | 481,317 | 77,798 |
a. Compute return on equity (ROE) for the two recent years.
b. Compute return on assets (ROA) for the two recent years.
c. Compute profit margin (PM) for the two recent years.
d. Compute asset turnover (AT) for the two recent years.
- Round ROE, ROA and PM to one decimal place (example: 0.2345 = 23.5%).
- Round AT to two decimal places (example: 1.35).
e. Which of the following best explains the change in ROA during 2018?
- The company’s profitability weakened considerably.
- The company’s asset productivity weakened considerably.
- The company had higher sales in 2018.
- The company had higher assets 2018.
Feedback
Correct
Marks for this submission: 9.00/9.00.
Question 2 – Formulating Financial Statements from Raw Data and Calculating Ratios
Following is selected financial information from General Mills Inc. for its fiscal year ended May 27, 2018 ($ millions).
| Cost of goods sold (COGS) | $10,312.9 | Cash from operating activities | $2,841.0 |
| Cash from investing activities | (8,685.4) | Noncash assets, end of year | 30,225.0 |
| Cash, end of year | 399.0 | Cash from financing activities* | 5,477.3 |
| Income tax expense | 57.3 | Total assets, beginning of year | 21,812.6 |
| Revenue | 15,740.4 | Total liabilities, end of year** | 24,131.6 |
| Total expenses, other than COGS | 3,207.2 | Stockholders’ equity, end of year | 6,492.4 |
| and income tax |
* Cash from financing activities includes the effects of foreign exchange rate fluctuations.
** Total liabilities includes redeemable interest.
a. Prepare the income statement for the year ended May 27, 2018.
Note: Do not use negative signs with any of your answers.
b. Prepare the balance sheet as of May 27, 2018.
c. Prepare the statement of cash flows for the year ended May 27, 2018.
Note: Use a negative sign with your answer to indicate cash was used by activities and/or a decrease in cash.
d. Compute ROA.
e. Compute profit margin (PM).
f. Compute asset turnover (AT).
Notes:
Round ROA and PM to one decimal place (ex: 10.5%)
Round Asset turnover to two decimal places (0.33)
Feedback
Correct – Marks for this submission: 39.00/39.00.
Question 3 – Comparing Ratios for Luxury and Budget Retailers
Following are selected financial statement data from Capri Holdings (a retailer that owns upscale brands Michael Kors, Jimmy Choo, and Versace) and Five Below (a value-priced toy and novelty retailer).
| Capri Holdings ($ millions) | Five Below ($ thousands) | |||
|---|---|---|---|---|
| 2018 | 2017 | 2018 | 2017 | |
| Sales | $4,718.6 | $4,493.7 | $1,559,563 | $1,278,208 |
| Cost of sales | 1,859.3 | 1,832.3 | 994,478 | 814,795 |
| Net income | 592.1 | 551.5 | 149,645 | 102,451 |
| Average equity | 1,805.0 | 1,794.0 | 536,826 | 394,982 |
Required
a. Calculate the gross profit for each company for both years. Gross profit is equal to sales minus the
cost of sales.
b. Calculate gross profit as a percentage of sales for each company for both years.
c. Compute the return on equity for each company for both years.
Notes:
For gross profit, enter Capri Holdings in millions and Five Below in thousands.
Round gross profit percentage and ROE to one decimal place (example: 0.2345 = 23.5%).
d. Which of the following best explains why the ratios for Five Below and Capri Holdings differ?
Select the corresponding number for the correct answer:
- Capri Holdings is much larger than Five Below and so its ratios are naturally larger.
- Five Below is a younger company and so its ratios are naturally lower.
- Capri Holdings’ brand recognition creates a competitive advantage, which allows the company to add a bigger markup to the products it sells.
- Five Below imports its products from Southeast Asia, which allows the company to keep product costs down.
Feedback
Correct – Marks for this submission: 13.00/13.00.
Solution – Module 1 Assignment
| Metric | Formula | 2018 Workings (Average of 2018 and 2017) | 2018 Answer | 2017 Workings (Average of 2017 and 2016) | 2017 Answer |
|---|---|---|---|---|---|
| Return on Equity (ROE) | ROE = Net Income ÷ Average Shareholders’ Equity × 100 | Average Equity = (72,496 + 77,869) ÷ 2 = 75,183. ROE = 6,670 ÷ 75,183 × 100 | 8.9% | Average Equity = (77,869 + 77,798) ÷ 2 = 77,834. ROE = 9,862 ÷ 77,834 × 100 | 12.7% |
| Return on Assets (ROA) | ROA = Net Income ÷ Average Total Assets × 100 | Average Total Assets = (204,522 + 219,295) ÷ 2 = 211,909. ROA = 6,670 ÷ 211,909 × 100 | 3.1% | Average Total Assets = (198,825 + 204,522) ÷ 2 = 201,673. ROA = 9,862 ÷ 201,673 × 100 | 4.9% |
| Profit Margin (PM) | PM = Net Income ÷ Sales × 100 | PM = 6,670 ÷ 510,329 × 100 | 1.3% | PM = 9,862 ÷ 495,761 × 100 | 2.0% |
| Asset Turnover (AT) | AT = Sales ÷ Average Total Assets | AT = 510,329 ÷ 211,909 | 2.41 | AT = 495,761 ÷ 201,673 | 2.45 |
Please click on the Icon below to purchase the full answer at only $10