Economics 2122A Econometrics I Assignment 1
Instruction: when you make your submission, please put your answers in a single file and upload it to “Assignment” on OWL.
Suppose that 20 customers provided their feedback in a coffee shop survey:
| Customer | First time to the store | Satisfaction | Money spent | |
| 1 | Yes | 5 | $18 | |
| 2 | Yes | 4 | $13 | |
| 3 | No | 1 | $0 | |
| 4 | No | 4 | $9 | |
| 5 | No | 5 | $8 | |
| 6 | No | 5 | $11 | |
| 7 | Yes | 4 | $12 | |
| 8 | No | 4 | $9 | |
| 9 | No | 3 | $8 | |
| 10 | No | 5 | $15 | |
| 11 | No | 5 | $13 | |
| 12 | No | 4 | $12 | |
| 13 | No | 4 | $10 | |
| 14 | No | 4 | $9 | |
| 15 | No | 3 | $13 | |
| 16 | No | 1 | $15 | |
| 17 | No | 5 | $11 | |
| 18 | No | 4 | $12 | |
| 19 | Yes | 4 | $9 | |
| 20 | No | 5 | $14 |
Question 1
Fill up the following table using information from Table 1:
Time needed for Task 1
| Intervals of money spent | 0≤ x <4 | 4≤ x <8 | 8≤ x <12 | 12≤ x <18 |
| Number of customers |
According to Table 1:
- Is the answer to each survey question categorical or numerical? If categorical, give the level of measurement. If numerical, is it discrete or continuous, interval or ratio?
- draw a histogram of the money spent based on the table in Question 1.
- Choose a graphical discerption for the variable “first time to the store” and draw the graph. Explain your choice of the graph.
- Choose a graphical discerption for the variable “satisfaction” and draw the graph. Explain your choice of the graph.
Question 3
The daily sales (in hundreds of dollars) for a company from a random sample of 10 weekdays are
6 8 10 12 14 9 11 7 13 11
- Find the median and the mode
- Find the mean of this sample
Question 4
Suppose the rate of returns on common stocks over a 5-year period were as follow:
10% 4% -5% 15% 20%
- Find out the total growth (in %) over this 5-year period
- Find out the annual geometric mean rate of return.
Question 5
A random sample for five exam scores produced the following data:
| Hours Studied (x) | Test Grade (y) |
| 3.5 | 85 |
| 2 | 74 |
| 5 | 88 |
| 4.5 | 90 |
| 1.5 | 70 |
- Compute the covariance
- Compute the correlation coefficient
- Comment on the correlation according to your results in (a) and (b)
Question 6
List the important formulas you would like to include in your formula sheet.
Related: (Solution) Economic 2122A – Econometrics I Assignment 2
Solution – Economics 2122A Econometrics I Assignment 1
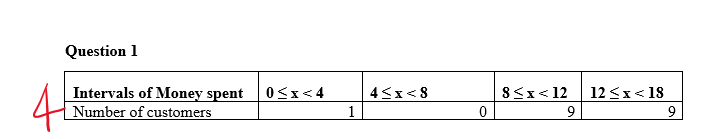
Question 1
| Intervals of Money spent | 0 ≤ x < 4 | 4 ≤ x < 8 | 8 ≤ x < 12 | 12 ≤ x < 18 |
| Number of customers | 1 | 0 | 9 | 9 |
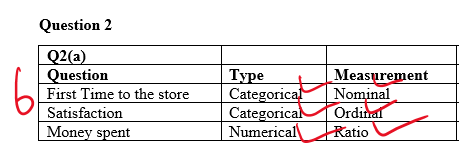
| Q2(a) | |||
| Question | Type | Measurement | |
| First Time to the store | Categorical | Nominal | |
| Satisfaction | Categorical | Ordinal | |
| Money spent | Numerical | Ratio | Continuous |
..Please click on the Icon below to purchase the full answer at only $7