BUS 5413 Analysis Assignment #3
Instructions
Using the Excel worksheet provided (note tabs at the bottom) respond to the following questions and scenarios. Your submission for this assignment should include two documents. A word document containing your answers, as well as your excel sheet showing your work in finding those answers. Shoe Sales Data Respond to the following questions. These are “short answer” questions; some correct answers can be just one word. Whole sentences are not required. Your response should be complete but as brief as possible—quality outweighs quantity.
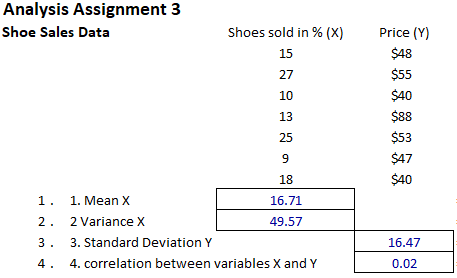
1. Use Excel to calculate the mean for X for Shoe Sales Data.
2. Use Excel to calculate the variance of X Shoe Data.
3. Use Excel to calculate the standard deviation for Y Shoe Data.
4. Use Excel to calculate the correlation between variables X and Y of Shoe Data. Insert correlation matrix in your Excel worksheet.
5. A correlation of 0 indicates that the two variables have no linear relationship with each other
True or False
6. “Pearson r” stands for what words?
7. When the relationship between two variables is perfect and inverse, what is the value of r?
8. Is it possible for a negative relationship to be strong?
Yes or No
9. Is an r of -.90 stronger than an r of .50?
Yes or No
10. Is an r of .75 stronger than an r of -.35?
Yes or No
11. Is a relationship “direct” or “inverse” when those with high scores on one variable have high scores on the other and those with low scores on one variable have low scores on the other?
12. What does an r of 1.00 indicate?
13. For a Pearson r of .60, what is the value of the coefficient of determination?
14. What must be done in order to convert a coefficient of determination into a percentage?
15. A Pearson r of .70 is what percentage better than a Pearson r of 0.00?
16. Name two variables (examples) between which you would expect to get a strong, positive value of r.
Respond to the following questions from the “excerpt from a research article.” These are “short answer” questions; some correct answers can be just one word. Your response should be as complete but as brief as possible—quality outweighs quantity.
Excerpt from a research article
Participants in this study were a volunteer sample of full-time undergraduate students at a small, private, liberal arts college in South Africa. We measured depression symptomatology by using the CES-D. The CES-D is a 20-item, 4-point Likert scale commonly used to assess depressive symptomatology in the general population. Scores range from 0 to 60; a score of 16 or greater is considered positive for depression. We assessed self-esteem by using the RSES, which is aI0-item, 4-point Likert scale considered a reliable and valid self-report scale commonly used to assess feelings of self-worth. The range of possible scores is 10 to 40; the higher the score, the higher the self-reported self-esteem. The SCS-R is a 20-item, 6-point Likert scale used to “measure social connectedness as a psychological sense of belonging.” Scores are summated and range from 20 to 120. Higher scores indicate greater levels of social connectedness and belongingness.
Table 1
Pearson’s Product Moment Correlations Between the Dependent Measures (n = 227)
| Measure | Depression | Social connectedness |
| Self-esteem | -.372 | .414 |
| Depression | — | -.619 |
17. What is the value of the correlation coefficient for the relationship between “Depression” and “Self-esteem”?
18. Which one of the following pairs of variables has a stronger relationship between them?
- Depression and Social connectedness
- Depression and self-esteem
19. Which one of the following pairs of variables has a weaker relationship between them?
- Self-esteem and social connectedness
- Self-esteem and depression
20. The correlation coefficient for the relationship between Depression and Self-esteem indicates which of the following?
- Those who experience more Depression tend to have higher Self-esteem.
- Those who experience more Depression tend to have lower Self-esteem.
21. In your opinion, does the Pearson r of -.372 prove that high depression causes lower self-esteem?
The following questions require accessing the data files:
Call Center Data.xlsx
Infant Mortality.xlsx
Pile Foundation.xlsx
Self Esteem.xlsx
Foundation Bid
22. A building foundation engineering contractor has bid on a foundation system for your company’s new headquarters. A part of the project consists of installing 311 auger cast piles (auger cast piles are a type of drilled foundation where the pile is drilled to the final depth in one continuous process using a continuous flight auger). The contractor was given bid information for cost‐estimating purposes, which included the estimated depth of each pile; however, actual drill footage of each pile could not be determined exactly until construction was performed. The Excel file Pile Foundation contains the estimates and actual pile lengths after the project was completed. Using the Excel file Pile Foundation.xlsx, compute the correlation coefficient between the estimated and actual pile lengths, and calculate the Coefficient of Determination. What does this tell you?
23. Call centers have high turnover rates because of the stressful environment. The national average is approximately 50%. The director of human resources for a large bank has compiled data from about 70 former employees at one of the bank’s call centers (see the Excel file Call Center Data). For this sample, report the correlation coefficient and how strongly is the length of service correlated with starting age?
Infant Mortality
24. The Excel file Infant Mortality provides data on infant mortality rate (deaths per 1,000 births), female literacy (percentage who read), and population density (people per square kilometer) for 85 countries. The Excel file Infant Mortality provides data on infant mortality rate (deaths per 1,000 births), female literacy (percentage who read), and population density (people per square kilometer) for 85 countries. Compute the correlation matrix for these three variables. Compute the correlation matrix for these three variables. What conclusions can you draw?
Related: (Solution) BUS 5413 Discussion 3 Understanding Measurement
Solution – BUS 5413 Analysis Assignment #3
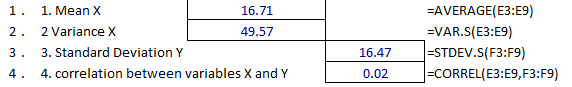
Question 1 requires us to calculate the mean using excel. To do this we use the =AVERAGE formula and then select the the cells that have the shoes sold data. In this case the formula will be =AVERAGE(E3:E9). See below image for the correct answer
Question 2 requires us to Use Excel to calculate the variance of X Shoe Data. To do this we use Excel formula =VAR.S(E3:E9) See below image for correct answer
Question 3 requires us to Use Excel to calculate the standard deviation for Y Shoe Data. We calculate this by using the formula =STDEV.S(F3:F9)
Question 4 requires us to Use Excel to calculate the correlation between variables X and Y of Shoe Data. Insert correlation matrix in your Excel worksheet. We do this by using the following formula =CORREL(E3:E9,F3:F9)
..Please click on the Icon below to purchase the full answer at only $10