…Please click on the Icon below to purchase the FULL ANSWER IN EXCEL at only $20

…Please click on the Icon below to purchase the FULL ANSWER IN EXCEL at only $20
| Capital Budgeting – The Coca-Cola Company (KO) | ||||||||||||||
| The Coca-Cola Company (KO) is considering selling a new fruit drink. KO has spent $520,000 to develop and test market the new product, | ||||||||||||||
| and the new fruit drink will initially be introduced to a limited regional market in order to better gauge demand before taking it national. | ||||||||||||||
| This introduction stage will last four years. During this introductory stage, the fruit drink will have a selling price of $2.19 per unit. | ||||||||||||||
| The current plant facility in this region has excess capacity in a fully depreciated building to process the fruit drink product line. | ||||||||||||||
| The new equipment costs $2,615,000 and is depreciated to zero under the 3-year MACRS depreciation schedule. Projected sales | ||||||||||||||
| are 3,670,000 units in the first year, with a 6.75% growth rate for each subsequent year. Variable costs are 67% of total revenues, | ||||||||||||||
| and fixed costs are $1,425,000 per year. Currently, similar projects in the portfolio of KO require $0.19 in net working capital | ||||||||||||||
| (NWC) to support each dollar of sales in each year. In other words, as revenues change, NWC will adjust to support this | ||||||||||||||
| change. The NWC needed for each sales year must be in place at the beginning of that year (i.e., by the end of the previous year). | ||||||||||||||
| All changes to NWC will be liquidated and recovered by project-end, and the new equipment is forecasted to have a salvage | ||||||||||||||
| value of $415,000 at this time. The corporate tax rate for KO is 21%. | ||||||||||||||
| Step 1: Calculate KO’s Weighted Average Cost of Capital (WACC) using the “WACC” tab. | ||||||||||||||
| Navigate to Yahoo! Finance to begin gathering data. | ||||||||||||||
| a. Start by entering the ticker ‘KO’ on the home page on Yahoo!Finance in the Quote Lookup window. | ||||||||||||||
| b. Enter the current stock price from Yahoo!Finance. For consistency, I have entered the current stock price on KO as the closing price on Friday, October 18, 2024 | ||||||||||||||
| c. Look up the estimated growth rate, expected dividend, beta, and shares outstanding on Yahoo!Finance using the following steps: | ||||||||||||||
| 1. Enter the ticker symbol for KO under quote lookup in order to go to the KO summary page. | ||||||||||||||
| 2. Click on the Analysis tab. | ||||||||||||||
| 3. You will find the ‘Next 5 Years (per annum)’ growth rate at the bottom of the page under the Growth Estimates section. | ||||||||||||||
| 4. Beta and shares outstanding are on the Statistics tab under Stock Price History and Share Statistics, respectively. | ||||||||||||||
| 5. Next period’s expected dividend is under Dividends & Splits on the Statistics tab and is labeled as the ‘Forward Annual Dividend Rate’. | ||||||||||||||
| d. The Five-year Treasury Yield will be used as the proxy for the risk-free rate (because the project is expected to last four years) and can be found using the following steps: | ||||||||||||||
| 1. Navigate to the US Treasury Department website | ||||||||||||||
| 2. Click on the ‘Daily Treasury Par Yield Curve Rates’ from the DATA dropdown menu and record the 5-yr rate for October 18, 2024. | ||||||||||||||
| ***This data is already in percentage terms*** | ||||||||||||||
| g. To determine the market risk premium, we can rely on an annual report written by Pablo Fernandez from the IESE Business School in Spain. | ||||||||||||||
| Dr. Fernandez is a well-known finance researcher who conducts a global survey each year that simply asks companies, analysts, regulators, | ||||||||||||||
| and professors/academic researchers what market-risk premium and risk-free rate they are using. He compiles and reports the data in his annual report. | ||||||||||||||
| The 2024 report contains average market-risk premium and risk-free rate information for 96 countries. | ||||||||||||||
| The average market-risk premium for the U.S. can be found in Table 2 of this report, which can be downloaded for free at the following link: | ||||||||||||||
| Survey: Market Risk Premium and Risk-Free Rate used for 96 countries in 2024 by Pablo Fernandez, Diego Garcia de la Garza, Lucía Fernández Acín :: SSRN | ||||||||||||||
| f. Look up KO’s outstanding bond issues in order to calculate the firm’s weighted-average cost of debt. | ||||||||||||||
| 1. Navigate to the Financial Industry Regulatory Authority (FINRA) Bond Center page to begin gathering the bond data. | ||||||||||||||
| 2. Click on the View Data tab in the center of the page and enter ‘Coca Cola Co’ in the Issuer Name search window. Click Show Results. | ||||||||||||||
| ***You will need to expand the ‘Quick Filters’ search section in order to enter the Issuer Name. | ||||||||||||||
| 3. Collapse the ‘Quick Filters’ search section to view the list of outstanding bonds of Coca Cola Co. | ||||||||||||||
| ***We are only interested in the debt issues for COCA COLA CO that have not yet matured or been called*** | ||||||||||||||
| 4. These issues represent the list of KO’s outstanding bond issues that correspond to those listed in the “6.WACC” tab. | ||||||||||||||
| ***Click on the link for each bond for more information*** | ||||||||||||||
| 5. Fill in the input variable cells and create formulas in the calculation cells in order to calculate the firm’s weighted average cost of debt. | ||||||||||||||
| g. Calculate the weighted-average cost of capital (WACC) in the calculation cells at the bottom of the “WACC” tab. | ||||||||||||||
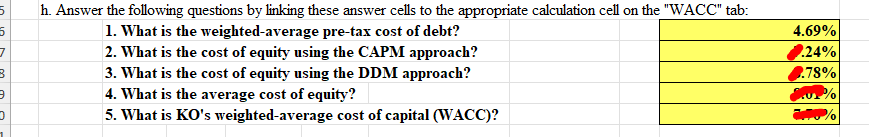
| h. Answer the following questions by linking these answer cells to the appropriate calculation cell on the “WACC” tab: | ||||||||||||||
| 1. What is the weighted-average pre-tax cost of debt? | ||||||||||||||
| 2. What is the cost of equity using the CAPM approach? | ||||||||||||||
| 3. What is the cost of equity using the DDM approach? | ||||||||||||||
| 4. What is the average cost of equity? | ||||||||||||||
| 5. What is KO’s weighted-average cost of capital (WACC)? | ||||||||||||||
| Step 2: Create a pro-forma income statement for each year of the project, calculate the base case NPV & | ||||||||||||||
| IRR, and conduct sensitivity analyses using the “Pro-Forma” tab | ||||||||||||||
| a. Use the input variables to create pro-forma income statements for each year of the project in order to calculate the PV of each year’s free cash flow in row 33. | ||||||||||||||
| (For row 33, you can either use the EXCEL formula PV() or use the algebraic formula for PV of a lump sum.) | ||||||||||||||
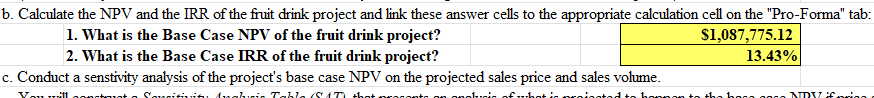
| b. Calculate the NPV and the IRR of the fruit drink project and link these answer cells to the appropriate calculation cell on the “Pro-Forma” tab: | ||||||||||||||
| 1. What is the Base Case NPV of the fruit drink project? | ||||||||||||||
| 2. What is the Base Case IRR of the fruit drink project? | ||||||||||||||
| c. Conduct a senstivity analysis of the project’s base case NPV on the projected sales price and sales volume. | ||||||||||||||
| You will construct a Sensitivity Analysis Table (SAT) that presents an analysis of what is projected to happen to the base case NPV if price and sales volume turn out to be +/- 20%. | ||||||||||||||
| To construct the SAT requires that you use the “What-If Analysis” tool that is located under “Data Tools” on the “Data” tab. | ||||||||||||||
| You will use the “Data Table” option under “What-If Analysis”. Part of the assignment is learning how to use this tool for sensitivity analysis. | ||||||||||||||
| Therefore, if you have not used this previously, you will need to research its use. | ||||||||||||||
| *** On the Pro-Forma tab, I have provided the template and many notes, hints, and cell commments to help guide you.*** | ||||||||||||||
| (The Sensitivity Analyses begins at row 39) | ||||||||||||||
| d. Calculate percentage and dollar sensitivities of NPV on both projected sales price and projected sales volume and link these answer cells to the appropriate calculation cell on the “Pro-Forma” tab: | ||||||||||||||
| 1. What is the Dollar (Cent) sensitivity of NPV to a change in Price? | ||||||||||||||
| 2. What is the Percentage sensitivity of NPV to a change in Price? | ||||||||||||||
| 3. What is the Dollar sensitivity of NPV to a change in Sales Volume? | ||||||||||||||
| 4. What is the Percentage sensitivity of NPV to a change in Sales Volume? | ||||||||||||||
| e. Conduct a sensitivity analysis of the project’s base case NPV on the projected fixed and variable costs. | ||||||||||||||
| You will construct a Sensitivity Analysis Table (SAT) that presents an analysis of what is projected to happen to the base case NPV if costs turn out to be +/- 12% for fixed costs | ||||||||||||||
| and +/- 12 percentage points for variable costs. | ||||||||||||||
| f. Calculate percentage and dollar sensitivities of NPV on both projected fixed and variable costs and link these answer cells to the appropriate calculation cell on the “Pro-Forma” tab: | ||||||||||||||
| 1. What is the Dollar sensitivity of NPV to a change in Fixed Costs? | ||||||||||||||
| 2. What is the Percentage sensitivity of NPV to a change in Fixed Costs? | ||||||||||||||
| 3. What is the Dollar sensitivity of NPV to a change in Variable Costs? | ||||||||||||||
| 4. What is the Percentage sensitivity of NPV to a change in Variable Costs? | ||||||||||||||
| g. What can you conclude about the new fruit drink project based upon the sensitivity analyses? | ||||||||||||||
| Step 3: Create a Base Case NPV profile using the “NPV Profile” tab. | ||||||||||||||
| a. Instructions for this graphing step are in red on the “NPV Profile” tab. | ||||||||||||||
| HINTS for all steps: | ||||||||||||||
| *Unless the value is given above (or pulled straight from external data sources), all highlighted cells require | ||||||||||||||
| a calculation done using formulas, or a reference to another cell. | ||||||||||||||
| *Do not forget the correct sign conventions. | ||||||||||||||
| *Double-check all calculations using your calculator | ||||||||||||||
| *Pay attention to cells with embedded comments (i.e., any cells with red triangles in the upper-right corner) | ||||||||||||||

BUY FULL SOLUTION AT ONLY $20. INSTANT DOWNLOAD