Economics 2122A Econometrics I Midterm Exam
(1) Which of the following is an example of ratio data?
- A) Income of a household
- B) Temperature (℃) in a classroom
- C) Levels of customer satisfaction: not satisfied = 1; neutral = 2; satisfied = 3
- D) Whether you have any work experience: yes = 1; no = 0
(2) Companies are often interested in knowing how customers learned about their products. They often solicit this information on mail-in warranty cards. The customers’ responses for a particular product were gathered and the data are presented in the pie chart below.
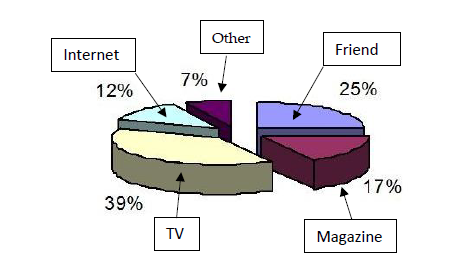
What percentage of respondents learned about the product through television or the Internet?
- A) 12%
- B) 39%
- C) 51%
- D) 100%
(3) When interpreting a covariance,
- A) it’s important to look at the +/– sign.
- B) it’s important to look at the magnitude.
- C) it indicates the strength of the relationship.
- D) all of the above
(4) Suppose the rate of returns on common stocks over a 4-year period were as follow:
10%, -4%, 5%, 8%
To find the mean annual growth rate, we use the ; the mean annual growth rate is around.
- A) arithmetic mean; 4.8%
- B) weighted mean; undefined because we do not know the weights
- C) geometric mean; 4.6%
- D) median; 6.5%
(5) Suppose you roll a pair of dice. Let A be the event that you observe an even number. Let B be the event that you observe a number greater than seven. What is A ∩ ?
- A) [9, 11]
- B) [8, 10, 12]
- C) [3, 5, 7]
- D) [2, 4, 6]
(6) The probabilities for television viewings and income levels of a population are shown as follow.
Randomly pick a person from this population. The probability that this person has middle income is , the probability that this person has middle income and watches TV regularly is . If the person reveals he/she has low income, the probability of this person watching TV regularly is . A) 41%; 13%; 13% B) 13%; 21%; 4% C) 41%; 21%; 4% D) 41%; 13%; 12.5% (7) On average, you receive 2.6 pieces of junk mail a day. Assume that the number of pieces of junk mail you receive each day follows the Poisson distribution. The expected number of pieces of junk mail you receive daily is . The probability of receiving more than three pieces of junk mail today is __.
- A) 6.76; 0.123
- B) 2.60; 0.264
- C) 1.61; 0.482
- D) none of the above
(8) When sampling without replacement from a finite population such that the probability of a success is no longer constant from trial to trial, the data must follow a:
- A) Binomial distribution.
- B) Poisson distribution.
- C) hypergeometric distribution.
- D) continuous probability distribution.
(9) One normal distribution has a mean of 5 and a standard deviation of 2. A second normal distribution has a mean of 6 and a standard deviation of 1. Which of the following statements is true?
- A) The dispersion of the first distribution is larger than the second distribution.
- B) The central location of the first distribution is higher than the second distribution.
- C) The dispersions of both distributions are the same.
- D) The locations of both distributions are the same.
(10) When the distribution of a continuous random variable follows a uniform probability distribution and does not exceed a specific given value, its cumulative distribution function is graphed as:
- A) a bell-shaped curve.
- B) a polygon.
- C) a rectangle.
- D) straight lines.
Short Answer
(1) A company receives a shipment of 16 items. A random sample of 4 items is selected, and the shipment is rejected if any of these items proves to be defective.
a. What is the probability of accepting a shipment containing 4 defective items?
b. What is the probability of rejecting a shipment containing 1 defective item?
(2) A client has an investment portfolio whose values follow a normal distribution with mean value $500,000 and standard deviation $30,000. What is the probability that the value of this client’s portfolio is between $450,000 and $560,000?
Related: (Solution) Economics 2122A Econometrics I Assignment 5
Solution – Econometrics I Midterm Exam
The correct answers for the multiple choice questions in Econometrics I Midterm Exam are highlighted
Which of the following is an example of ratio data?
- A) Income of a household
- B) Temperature (℃) in a classroom
- C) Levels of customer satisfaction: not satisfied = 1; neutral = 2; satisfied = 3
- D) Whether you have any work experience: yes = 1; no = 0
(2) Companies are often interested in knowing how customers learned about their products. They often solicit this information on mail-in warranty cards. The customers’ responses for a particular product were gathered and the data are presented in the pie chart below.
What percentage of respondents learned about the product through television or the Internet?
12%+39% = 51%
- A) 12%
- B) 39%
- C) 51%
- D) 100%
…Please click on the Icon below to purchase the full answer at only $10