MGMT 648 Applied Finance Week 1 Assignment
Part 1: Bond pricing sensitivity
The first worksheet of the homework template (‘Part 1’) provides a basic bond pricing spreadsheet. This is similar to the bond pricing sheet we used in class. The assignment is to perform a sensitivity analysis of bond prices to changes in the YTM. Please include the following outputs:
- The bond price for the displayed inputs – in cell C19.
- A table of bond prices for YTMs ranging from 1% to 10% in increments of 0.5% calculated using locked formulas and named cells (using the names indicated in parentheses). Please consider two maturities: 8 periods and 20 periods.
- A corresponding table of bond prices for the same YTMs, but calculated using an Excel Data Table. For this table, please also consider possible maturities of 8 periods and 20 periods.
- A chart of bond prices (on the y-axis) versus YTMs (on the x-axis). Again, the YTMs should run from 1% to 10% in increments of 0.5%. Please plot bond prices for both maturities from (2) & (3) above. That is, there should be one line for the 4-year bond and one line for the 10 year bond. Please format the plot so that the y-axis runs from $50 to
$175 in increments of $25. Label the lines and make the 10-year bond line dashed. (You can accomplish this using the chart tools formatting menu.)
Aside from the different maturities and YTMs, all other inputs should be kept the same as the template provides.
Part 2: Duration and price sensitivity
- Calculate the duration of a bond with a face of $1,000, a 6% coupon rate, and a 5% YTM with 1 payment per year and a maturity of 10 years, using two different methods:
- Weighting by the present value of cash flows
- The Excel DURATION formula
- Calculate the following:
- What are the approximate percentage and dollar changes in price for a 1% change in interest rates using the duration approximation formula?
- What are the actual percentage and dollar changes in price if interest rates increase by 1%?
Part 3: Duration, reinvestment risk, & price risk
Consider a guaranteed annuity contract issued by a life insurance company with a rate of 3.08% and a term of 20 years. For a $100,000 nominal amount, the insurance company is promising to pay $183,437.53 (=100,000*(1.0308)^20) to the holder of the guaranteed annuity contract in 20 years. (In practice, this lump sum would be spread out over a subsequent period as an annuity; for simplicity, we will assume a lump sum payment.) We want to know the interest rate risk exposure to the company if it funds this liability using a 30-year bond with a coupon rate of 3.08% issued at par. To do so, assume that in the first year, rates change to one of the five possible values in row 18 and then stay constant for the next 20 years. For each rate change, calculate two things: (1) the future value (as of 20 years down the road) of each coupon payment made by the 30-year bond for the next 20 years, and (2) the value at year 20 of the bond used to fund the obligation. For (1), assume the coupons are reinvested at the new prevailing interest rate. The sum of the reinvested coupons and the value of the bond are the total future value of the assets used to finance the annuity contract.
What is the duration of the 30-year bond as of today? What is the duration of the guaranteed annuity contract? Briefly describe how the value of the reinvested coupons and the value of the bond change as a function of interest rate changes. Will the insurance company be able to meet its obligation to the purchaser of the guaranteed annuity contract?
Book a private accounting tutoring session
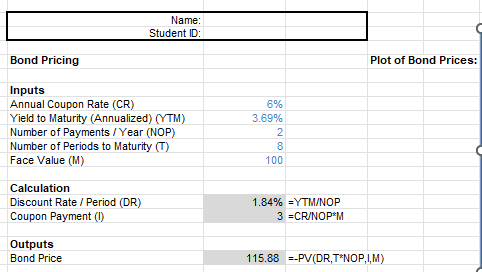
Solution – MGMT 648 Applied Finance Week 1 Assignment
Using the names indicated in parentheses rename the cells off your input data. To do this click on a cell you need to name and then go to the name box (just left of the formula bar), that currently hold the coordinates of selected cells. There you can put the name in the parentheses.
In cell C15, Calculate the discount rate per period by dividing the Yield to maturity(YTM) by the Number of Payments / Year(NOP). The formula will look like this; =YTM/NOP
In cell C16, you calculate the Coupon payment (I) by multiplying the annual coupon rate(CR) by the Face Value (M) and then divide that by the number of payments / Year (NOP). The formula in Excel will look like this =CR/NOP*M
In cell C19, you’ll calculate the bond price using the given inputs (such as face value, coupon rate, YTM, etc.). This can be done using the bond pricing formula in Excel, this is the formula; =-PV(DR,T*NOP,I,M)
How to create the data table in Excel,
To create the data table, you need to inform excel the inputs that are changing from the original calculations … Please click on the Icon below to purchase the full answer at only $15